

TL;DR
• Bitcoin correlation with global easing index inverted from positive to negative value in 2026
• Institutional accumulate positions months before Federal Reserve announces policy adjustments publicly
• Exchange traded fund inflows total fifty six billion dollars cumulative first quarter 2026
• Long term holders maintain supply while exchange reserves drop consistently toward lows
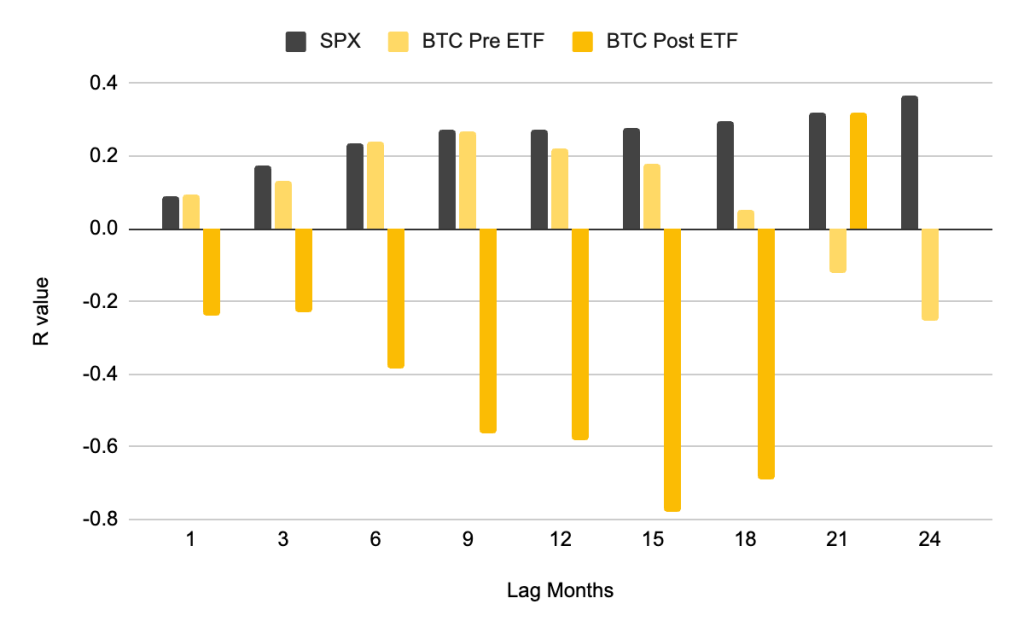
Bitcoin price behavior shows a profound structural alteration during 2026. Binance Research data reveals a complete reversal in correlation with the Global Easing Breadth Index. The composite tracks monetary policy direction across 41 central banks worldwide. Previously, a positive correlation of 0.21 existed before spot ETF approval. Now, a negative reading of −0.778 defines the relationship. Such inversion represents more than weakening; it signals complete structural change.
The new pattern runs nearly three times stronger in the opposite direction. Active traders relied on macro signals for position decisions over the past decade. Current evidence suggests those triggers lost primary status in market analysis.
Bitcoin evolved from a macro lagging receiver to a leading pricer. Institutional participants now front-run Federal Reserve interest rate decisions rather than react. ETF flow headlines that once moved markets within hours generate indifference now. If the thesis holds, the entire macro playbook requires fundamental revision. CPI prints, FOMC language, and rate trajectory models once drove BTC positions. Binance data suggests those variables moved to secondary status in 2026. Knowing what replaced them provides the edge for market participants today.
Institutional investors entering through ETF vehicles operate on different timelines entirely. Binance Research documents position building 6–12 months ahead of expected policy changes. Such behavior effectively prices Fed decisions before official announcements arrive. When the Fed finally eases, Bitcoin already moved in anticipation. The correlation appears negative to observers measuring data in real time. Retail traders dominated price discovery before January 2024 spot ETF launch in United States.
Signal Hierarchy Reordering for Traders in Second Quarter
The practical consequence of the Binance thesis reorders signal priority completely. Traders treating CPI prints and FOMC meetings as tier-one catalysts use outdated inputs. The new signal stack places weekly ETF flow data in first position. Long-term holder supply and exchange reserve metrics occupy second place in hierarchy. Legislative and regulatory developments follow in third position for consideration. Federal Reserve language remains a distant fourth in the current framework.
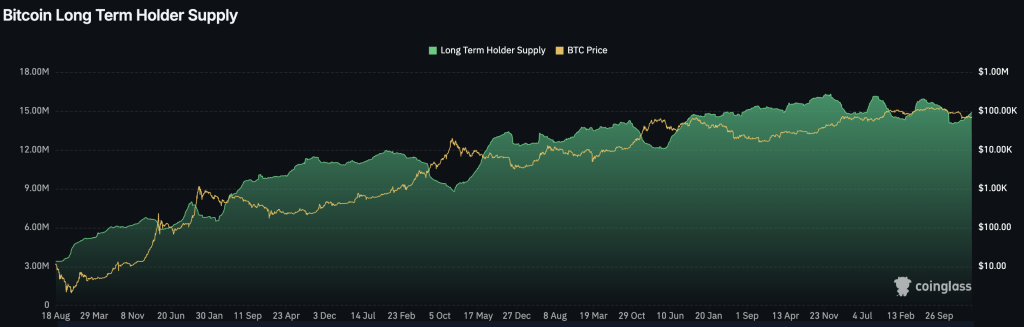
The bull case requires three conditions remaining intact for price support. ETF inflows must sustain above one billion dollars monthly through Q2. Exchange reserves must continue declining toward multi-year lows consistently. Long-term holder supply must hold above 14.5 million BTC without distribution.
If the three conditions persist simultaneously, supply-demand math supports specific price structure. The 90,000 dollar level functions as support rather than resistance under such circumstances. The Bitwise supply-shock thesis moves from projection to observable market pattern.
The bear case activates if institutional conviction breaks under pressure. A return to sustained ETF outflows signals the marginal buyer stepped back. Specifically, two consecutive months above 2 billion net negative would change structure. Such scenario removes the demand anchor holding the decoupling structure in place. Macro sensitivity could partially reassert under such conditions for price action. The 70,000–72,000 dollar on-chain support band becomes the first meaningful test level. Current technical analysis identifies the zone as crucial for asset stability now.
On-chain data reinforces the structural argument for patient capital accumulation. Long-term holder supply remained at historically elevated levels through Q1 2026. Price volatility failed to distribute coins toward sell-side liquidity during the period.
Exchange reserve depletion continues across the trading cycle consistently. Bitcoin held on centralized exchanges trended lower through market fluctuations. Such signal indicates coins moving into cold storage rather than toward selling. The MVRV ratio, comparing market cap to realized cap, held below 2.0. The indicator shows the market remains well below the euphoria zone historically.
Internal metrics describe a market structure where supply contracts steadily. Patient capital dominates current trading conditions across multiple timeframes. Such conditions make Bitcoin less reactive to short-term macro noise. The decoupling thesis becomes concrete through available data sources. Bitcoin does not ignore the Fed because traders became irrational. The asset ignores the Fed because the marginal buyer changed profile. The new marginal buyer already knows what the Fed will do.
Binance Research stated plainly that a peak in global easing may be old news. Watching monthly ETF flow totals and LTH supply confirms the thesis faster. Institutional investment operates on a fundamentally different timeline than retail participation. ETF vehicles allow large players to position capital with anticipation. Market efficiency increases when information prices before official announcement arrives.
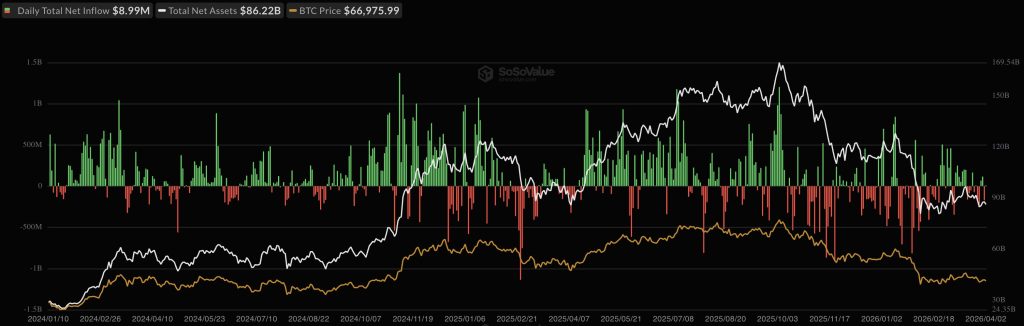
The ETF market scale reaches unprecedented figures in Bitcoin history. Cumulative inflows reached 56 billion dollars by the first quarter of 2026. Assets under management total approximately 87.5 billion dollars in aggregate. Such amount represents about 6% of Bitcoin total market capitalization.
A flow reversal signal appeared after outflows from November 2025 through February 2026. ETFs absorbed between 1.3 and 2.5 billion in inflows during March 2026. Institutions treat dips as accumulation opportunities under the new regime.
Bitwise projects ETFs will purchase more than 100% of all new Bitcoin issuance in 2026. The demand-supply dynamic has no historical precedent in BTC market structure. Artificial scarcity created by regulated vehicles sustains prices upward consistently. Miners sell less pressure to the open market due to institutional demand. Such scenario creates a supply shock that drives fundamental valuation higher. Market participants must adapt valuation models to the new reality now.