
In this article, discover the definition and the method of calculating volatility and its index, the Vix, better known as the fear index. We will also introduce you to the different financial products that allow you to trade and take advantage of volatility.
What is volatility ?
Over time, financial assets are distinguished by periods of greater or lesser volatility depending on various elements such as the macro economy, various corporate economic events, political news, institutional buying or selling moves, etc.
In financial markets, there are many factors that explain periods of volatility, but there are also phases of volatility that cannot be rationally explained. Volatility is used as an indicator to measure the level of risk and it is distinguished through two main factors : amplitude and time.
Amplitude is the difference between a low point and a high point.
Is this financial asset, in your opinion, volatile? Not necessarily, because it will depend on the time factor. If this 75% amplitude is realized over a very long term period of 20 years, the asset will not be considered volatile. On the other hand, if this variation is achieved over the short term, during a few months for example, then the asset will be considered very volatile.
In conclusion, the volatility of a financial asset is characterized by the combination of the time and magnitude factors of the asset’s price changes.
What is the Vix? The volatility index or the fear index
Highly followed by analysts around the world, the VIX is the benchmark indicator when it comes to measuring the volatility of the U.S. markets. It is an indicator that is calculated and published by the CBOE (Chicago Board Options Exchange), the exchange where the most options are traded in the US, and this is no coincidence, as the measure of volatility is very important for Options traders, especially for calculating the amount of the options premium.
The VIX measures the volatility of the US markets
The VIX measures the volatility of the US S&P 500 index. The higher the VIX, the more volatile the S&P 500 is and vice versa. Beyond the S&P 500, since the US markets often ” lead the way ” in global stock markets, the VIX is often taken as a benchmark for overall market volatility.
For information, although it is much less used, the equivalent of the VIX for Europe is the VSTOXX (EURO STOXX 50 Volatility).
Over the past 20 years, the VIX has exceeded 80 twice: during the 2008 financial crisis known as the ” subprime ” and in March 2020 during the ” covid ” crisis.
The VIX primarily indicates the volatility of equity markets. However, stocks are not the only asset class to experience phases of volatility and all other asset classes can face it : bonds, commodities and agricultural, derivatives, crypto-currencies, real estate, art, luxury goods, etc.
For the record, in 2011 the CBOE created a second index, the VVIX, which aims to measure the expected volatility on the VIX itself. An initiative that follows the fact that the VIX is now more than just an indicator, it is also an increasingly traded asset with derivatives.
The VIX calculation method
The method of calculating the VIX is relatively complex, and mathematicians can find the formula directly on the CBOE website.
For your information, here is the mathematical formula :
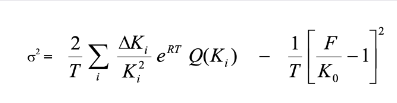
Source: IG
The key thing to remember is that the VIX is calculated by averaging the annual implied volatility of calls and puts on the S&P500. The higher the option price, the higher the volatility.
The VIX is expressed in terms of the percentage deviation from the standard annual return of the S&P 500.
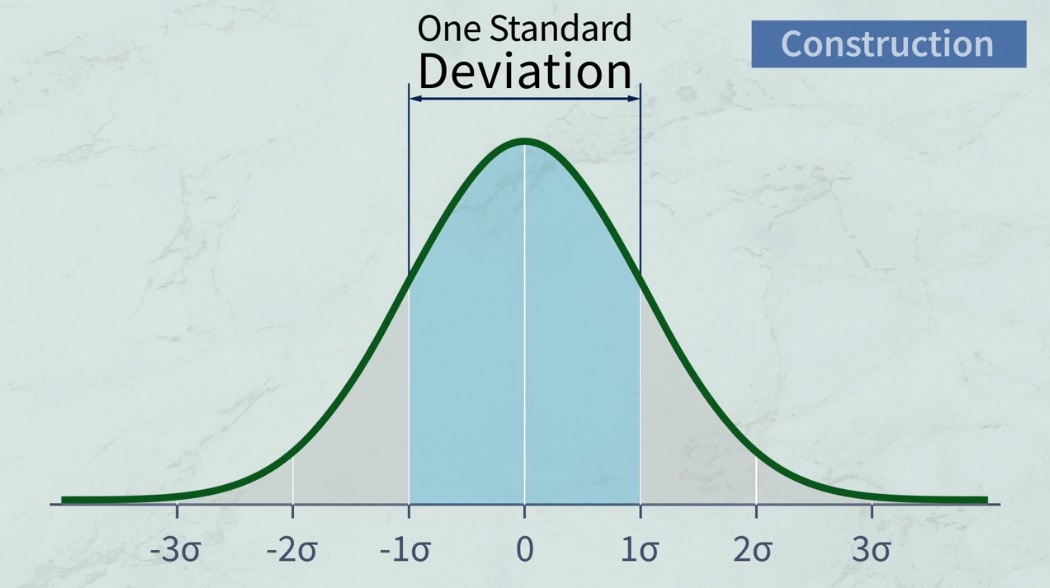
Source: CBOE
Implied volatility is a close approximation of historical volatility calculated directly from movements in the S&P 500 Index.
Here is the most common interpretation by analysts who use the VIX :
– Between 10 and 15, the S&P 500 volatility is low ;
– Between 20 and 30, volatility becomes more pronounced, making the market nervous ;
– Above 30, there is high volatility and the market may enter the ” fear ” or high anxiety zone.
Most importantly, we need to analyze the direction of movement rather than the absolute value of this index. The higher it goes, the more nervous the market becomes. Like all indicators based on an average of prices, it is also important to keep in mind that the VIX is not necessarily a good indicator for predicting future movements, but rather for noting the evolution of a situation.
History of the VIX Index since the VIX was created in 1986
Since 1986 and throughout the major crises of the past 30 years, the VIX has gone through extreme periods.
We can list 6 dates in which the VIX has exceeded the value of 50 :
- During the October 1987 crash (VIX : 150)
- During the Russian financial crisis of October 1998 (VIX : 60)
- During the September 11, 2001 attacks (VIX : 58)
- During the financial manipulation affair with the bankruptcy of Enron (VIX : 58)
- During the subprime crisis in 2008 (VIX : 59)
- During the Covid crisis in March 2020 (VIX : 82)
CBOE Vix Index price chart since 1990
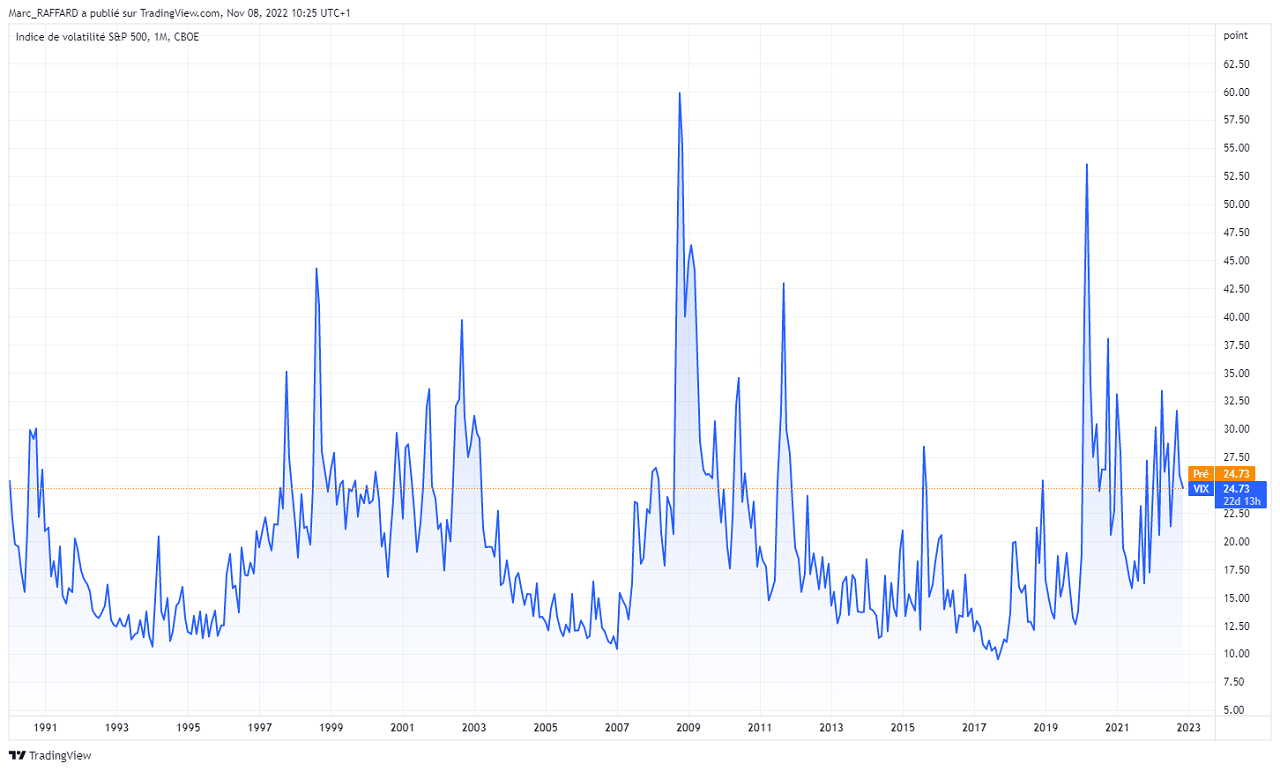
Source: TradingView
How to trade the VIX
As we’ve seen, the VIX is no longer simply an indicator to help analysts measure anxiety in the markets, but is now a financial product that can be traded in a variety of ways.
Option on the VIX Index
Investing in options on the VIX has been available since 2006 and is notably used as a hedge within portfolios.
Two types of options on the VIX exist :
- Call : call option to anticipate the rise of the VIX
- Put : put option to anticipate VIX decline
Thus, traders who are used to trading options will be able to speculate on the rise and fall of the index. They will be able to use the VVIX for their analysis and determine whether it is better to buy a call or a put, or whether the right strategy would be to sell a call or a put.
VIX futures
While options are perfectly suited for hedging strategies or swing trading, traders wishing to implement day trading or scalping strategies may want to look into VIX futures contracts.
Futures, or futures contracts, offer sufficient liquidity and reasonably low spreads to allow them to be used in many strategies, including very short-term (e.g., order book trading).
CFD on VIX
Reproducing futures contracts on the VIX, or directly the VIX index, CFDs allow less capitalized investors to be able to trade the VIX as well, knowing that the minimum amount on a CFD is significantly lower than on a Future contract. The CFD also allows the use of leverage for traders who are able to accept a higher risk.
What financial investments to bet on volatility ?
CITS specializing in volatility
There are mutual funds (Undertakings for Collective Investment in Transferable Securities) focused on volatility. With teams of managers who are experts in this sector, their goal is to generate performance via financial products based on volatility.
Examples include the Allianz Volatility Strategy Fund IT EUR Cap or Amundi Dynarbitrage Volatility IC mutual funds.
Hedge funds specializing in volatility
Some hedge funds bet their strategies on financial assets related to volatility like the hedge fund LJM Partners Preservation an Growth. The latter actually lost 82% of its assets under management (US$1 billion) in just a few days following the unexpected rise in the VIX in February 2018.
The hedge fund speculates on the volatility of the VIX
The U.S. speculative hedge fund specializing in volatility Options Solutions LLC of Man Group Plc also suffered setbacks in early February 2018 with losses to the tune of 65% of its total assets under management, and as a bonus, the obligation to sell positions.
Case-by-case asset selection can offer higher levels of volatility than VIX options or volatility-driven alternative mutual funds and hedge funds, some recent examples of which :
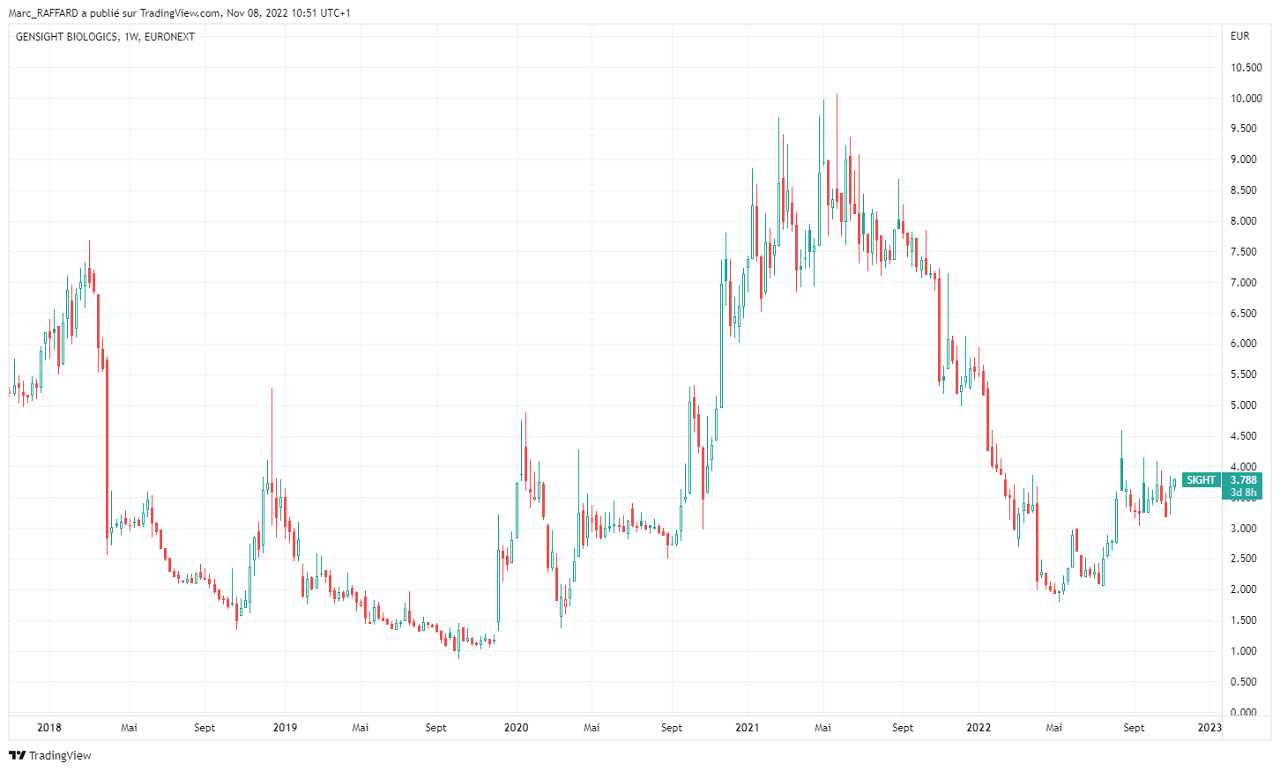
GENSIGHT BIOLOGICS stock
French stock Gensight Biologics has seen its share price rise from €1.10 at the end of 2019 to a high of €10.05 in May 2021, then fall back to €1.80 in May 2022, currently settling around €3.78.
Gensight Biologics share price chart since 2018
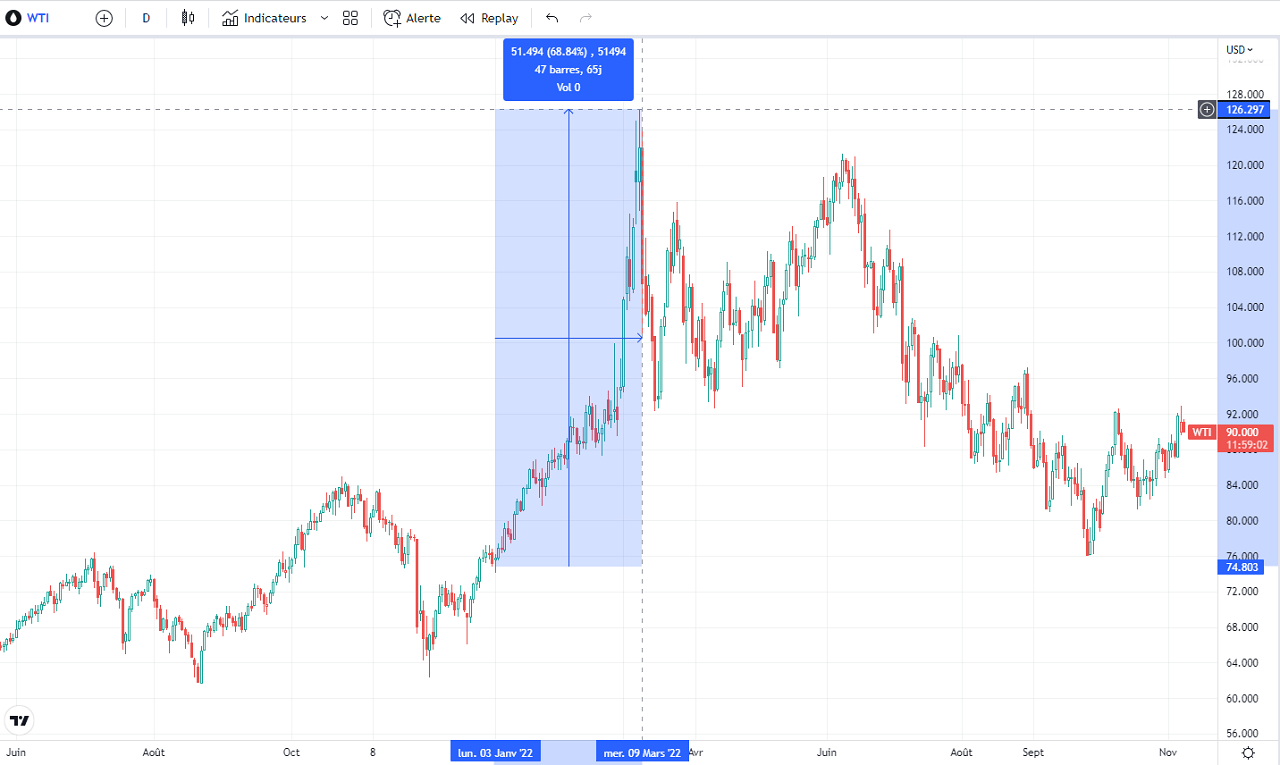
U.S. oil prices (WTI)
Oil prices have also been very volatile, especially since the beginning of 2022 as they gained 68% of their value between the beginning of January and mid-March 2022, eventually suffering a 39% drop from March 2022 to October 2022.
WTI price chart since June 2021
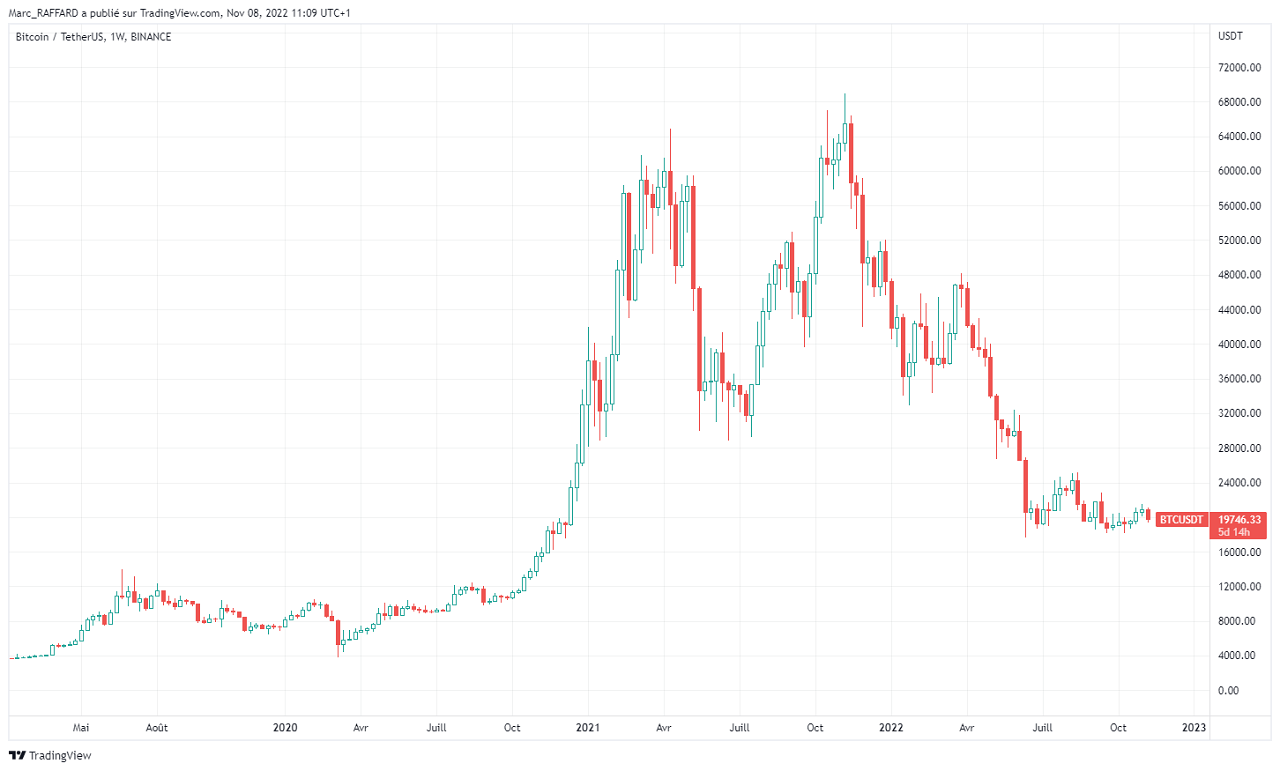
Bitcoin and crypto currency
Let’s also not forget about crypto-currencies, one of the most volatile assets of the moment, whose amplitudes of variation were very intense between November 2020 and June 2022.
The price of Bitcoin against the U.S. dollar rose from USD 15,000 in November 2020 to a high of USD 64,000 in April 2021, before dropping to USD 30,000 in June 2021. After that, Bitcoin prices quickly recovered to hit an all-time high of USD 68 000 in November 2021, only to fall back to less than USD 20 000 in June 2022.
Graph : Bitcoin/US dollar price since April 2019
Source: TradingView
As mentioned above, other asset classes can also be subject to volatility such as bonds, derivatives, real estate or more specific markets like art, luxury, wine, etc.
However, investors wishing to use a specific financial asset to profit from its volatility, such as a historically volatile stock for example, will need to have a very high level of expertise, as past volatility does not prejudge future volatility
In addition, it will be necessary to position oneself in the right direction ! Therefore, one will have to be very careful with this type of highly speculative approach.